In Part 1 of this series, I introduced you to the two questions at the heart of understanding and managing your cash flow.
You need to have the answers to these two questions in order to properly manage your cash flow and make smart decisions about how to use your cash.
- What happened to the cash?
- What’s about to happen to the cash?
And I shared the fact that your CFO has an important role to play in answering those two questions - every month.
Now let’s talk about the tools and approach I have used over a long career as a CFO.
They are proven and time-tested. I hope they work as well for you as they have worked for me and the companies I’ve implemented them for.
A Chance for Your CFO to Shine
Let’s say you are the CFO. Here’s your chance to shine. Here’s a perfect opportunity to add tremendous value for your CEO by taking a very proactive approach to answering these two questions.
And you will also be adding value for the company’s lenders, shareholders, and the Board of Directors. Every one interested in, or invested in, the financial success of the company will value a straightforward approach to answering these two cash flow questions.
Here are the components of the toolbox you will need:
- A visual, interactive cash flow dashboard
- The Peace of Mind schedule
- The GAAP cash flow statement
While it’s possible to use either of these tools alone to accomplish the objective, I generally use all three in tandem.
Each one helps accomplish a little different objective. They are especially effective when used together.
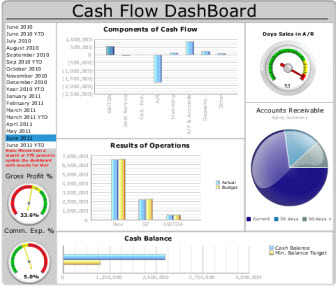
The Cash Flow Dashboard
One of the challenges in presenting information about cash flow is there is no single number you can present that tells the complete story.
Understanding cash flow is about revealing what happened in the handful of key drivers of cash flow. Of course, the more numbers you have to present to the CEO or others, the harder it is to make the information understandable.
That’s especially true since a change in any of those key drivers does not necessarily mean something good or bad on its own.
Many of the drivers must be understood based on the impact they have on each other.
This is where the cash flow dashboard can pay big dividends for you. It can harness both insight and focus in a very unique way.
Click on the Link to See the Interactive Dashboard
Take just a minute to look at the actual interactive cash flow dashboard in action here. It is a very unique tool in that it is interactive and uses visual cues to communicate understanding.
When you click on the link to the dashboard, you will see how you can mouse over the various time periods on the left and see each driver of cash flow for that period. The dashboard instantly, and interactively, displays the information graphically.
This kind of tool turns financial data into visual insight.
It uses red, yellow, green indicators so the user not only sees the data, but they can also see whether the data is good, bad or in between. The visual cues promote understanding.
There are a number of qualities that make this dashboard unique. One is the section in the top center labeled Components of Cash Flow. You can see graphically how each of the various drivers of cash flow impacted cash. You can also mouse over each bar and see the exact dollar amount.
Most business owners look at net income and believe that if they are making money than they are generating cash.
It would be nice if profits equaled cash flow – but they don’t.
You have to have visibility across all the drivers of cash flow if you are really serious about managing one of your most important assets. You can’t just focus solely on the income statement.
It also includes a view into gross margin and commission expense which are important drivers of cash flow in the business I created this dashboard for. It provides two views into accounts receivable. Both the aging of accounts receivable and the DSO (the number of days of sales that are sitting in receivables) are important drivers of cash flow in any given month.
A Second Cash Flow Dashboard Example
When you click on the link to the dashboard, you will also see a second cash flow dashboard I created for a franchise company. It makes it possible to mouse over the various franchisee locations on the left and see each of the key drivers of cash flow.
This is a great view when you have locations or businesses that are similar and you want a slick way to convey how each location is doing from a cash flow and key drivers perspective.
It makes the cash flow information fun and interesting to look at. That is a key to getting non-financial types to invest some time in discovering what the dashboard is telling them. It makes the information much more accessible.
It demonstrates that you have more than just spreadsheets and general ledgers in your financial reporting arsenal.
It facilitates the discussion you want to have about the different drivers of cash flow. It helps you provide the answer to the first cash flow question: “What happened to the cash?”
Next Step
The dashboard sets the stage for the other two tools we will be using to answer the two cash flow questions.
I have found that executives, and others, become more willing to go deeper and get more involved with the other tools once they begin to understand the handful of key drivers of cash flow.
They come to see that having the answers to the two cash flow questions makes running the business so much easier.
A cash flow dashboard is a very nice tool for helping you harness the power of turning financial data, in this case financial data about cash flow, into real insight.
In Part 3 of this series, I will share with you the next two tools for managing cash flow: The Peace of Mind Schedule and the GAAP cash flow statement.

Recent Comments